
I wanted a monitoring layer that could tell me when something was wrong in the cluster before I had to manually investigate it. Not just metrics sitting in a dashboard I'd have to remember to check — but something that fires an alert the moment a pod starts crash-looping or a node runs low on memory, with enough context to start investigating immediately.
For this setup, I used Prometheus to collect metrics from the cluster, Alertmanager to handle alert routing and send notifications to Slack, and Grafana to turn the metrics into dashboards. Node Exporter and kube-state-metrics provide the raw cluster-level metrics that Prometheus scrapes. The core metrics stack deploys with the kube-prometheus-stack Helm chart. The goal was not just to get the tools running but to build something that can be deployed repeatedly and managed through Git.
Why start with metrics
Metrics are numbers over time — CPU usage, memory consumption, request rates, pod restart counts. They are cheap to store and fast to query, which makes them the right starting point for understanding overall system health. Logs and traces are complementary signals used to investigate individual problems in more detail once metrics have identified something is wrong. Building the metrics layer first also means Grafana is already in place — when logs and traces are added in later posts, they become additional data sources in the same Grafana instance rather than separate tools.
Architecture

The core metrics stack is deployed together with kube-prometheus-stack. Node Exporter and kube-state-metrics expose metrics. Prometheus scrapes them every 15 seconds and stores 15 days of data. When a metric crosses a configured threshold, Prometheus evaluates the alert rule and, once the firing condition holds for the required duration, sends the alert to Alertmanager. Alertmanager deduplicates, groups, and routes to Slack. Grafana sits alongside Prometheus querying it to power dashboards.
What each component does
Prometheus — the core. It scrapes metrics from all configured targets, evaluates alerting rules on a fixed interval, and stores everything in a time-series database on disk. The other components either expose metrics for Prometheus to scrape, consume Prometheus data for visualisation, or handle the alerts Prometheus generates.
Node Exporter — runs as a DaemonSet, one pod per node. It reads hardware and OS metrics directly from the host — CPU, memory, disk, network. Without it, Prometheus has no visibility into what the actual machines are doing.
kube-state-metrics — watches the Kubernetes API and translates object state into metrics. While Node Exporter tells you about the machine, kube-state-metrics tells you about Kubernetes objects — pod phase, deployment replica counts, HPA current and desired targets, PVC binding status.
Alertmanager — receives alerts from Prometheus and handles the routing logic. It groups related alerts into single messages, deduplicates alerts that fire multiple times for the same reason, and routes to the right channel based on severity. Without Alertmanager, one incident could generate dozens of individual Slack messages.
Grafana — the visualisation layer. It connects to Prometheus as a data source and renders metrics as panels, graphs, and tables. Dashboards are provisioned automatically from ConfigMaps — no manual import required. In later posts, Loki and Tempo become additional Grafana data sources, keeping everything in one place.
Deploying the stack
The core metrics stack deploys with a single Helm chart:
helm repo add prometheus-community https://prometheus-community.github.io/helm-charts
helm repo update

helm upgrade --install kube-prometheus-stack prometheus-community/kube-prometheus-stack \
  --namespace monitoring --create-namespace \
  --values values/kube-prometheus-stack-values.yaml \
  --timeout 10m --wait
The values file controls retention period, resource limits, storage, and Grafana configuration. Alertmanager routing config is applied separately as a Kubernetes Secret so the Slack webhook URL is never committed to Git.
The first issue I hit was not Prometheus itself — it was storage. Prometheus and Alertmanager use PersistentVolumeClaims for data persistence so both survive pod restarts. On EKS this requires the EBS CSI driver addon. The addon installed without error, but the CSI driver could not provision the required EBS volumes. The driver logs showed AccessDenied: Not authorized to perform sts:AssumeRoleWithWebIdentity, which pointed to the IAM role configuration.
In this setup I used an OIDC-based IAM role (IRSA) to give the EBS CSI driver the EC2 permissions it needs:
aws eks create-addon \
  --cluster-name YOUR_CLUSTER_NAME \
  --addon-name aws-ebs-csi-driver \
  --region eu-west-1 \
  --service-account-role-arn YOUR_IRSA_ROLE_ARN
Once the role was attached and the driver restarted, the PVCs provisioned normally and Prometheus and Alertmanager started.
The second issue was an Alertmanager Secret ownership conflict. kube-prometheus-stack creates and manages its own Alertmanager Secret during install. Applying a custom Secret before the Helm install caused Helm to refuse — the existing Secret lacked the required Helm ownership metadata. The fix was straightforward: let Helm create the Secret first, then overwrite it with the routing config containing the Slack webhook and restart Alertmanager to pick it up.

Prometheus targets
Once everything was running, the next check was confirming Prometheus could actually discover and scrape the expected targets. Open Prometheus at http://localhost:9090/targets after port-forwarding:
kubectl port-forward svc/kube-prometheus-stack-prometheus 9090:9090 -n monitoring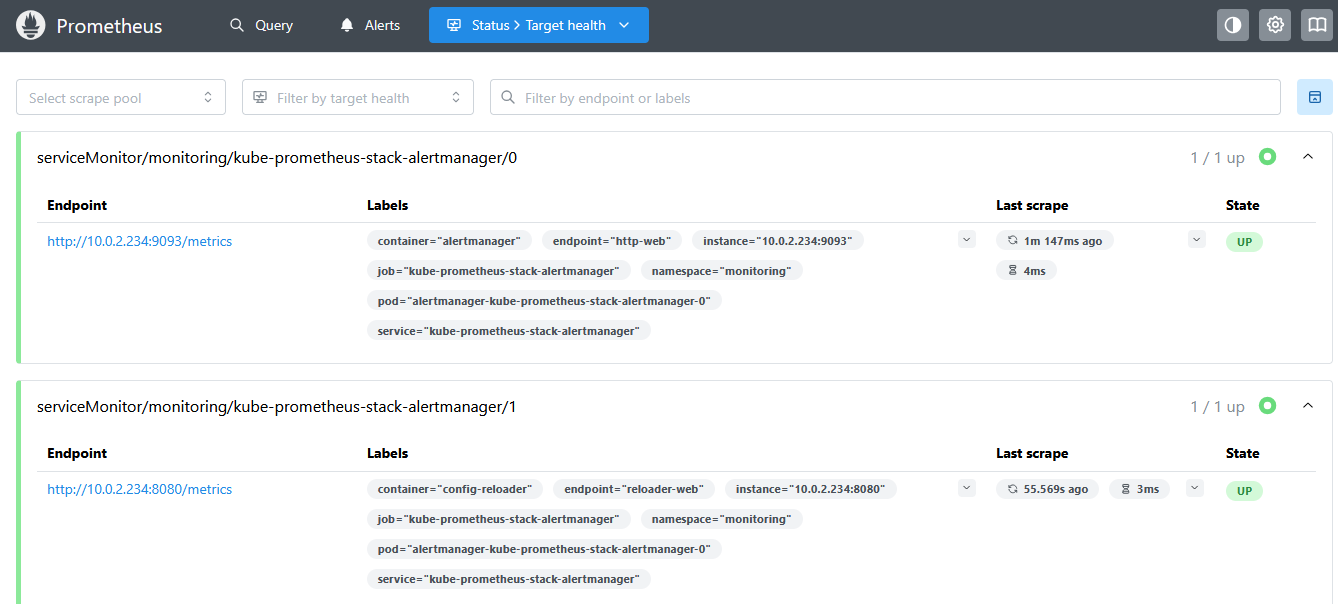
Grafana dashboards
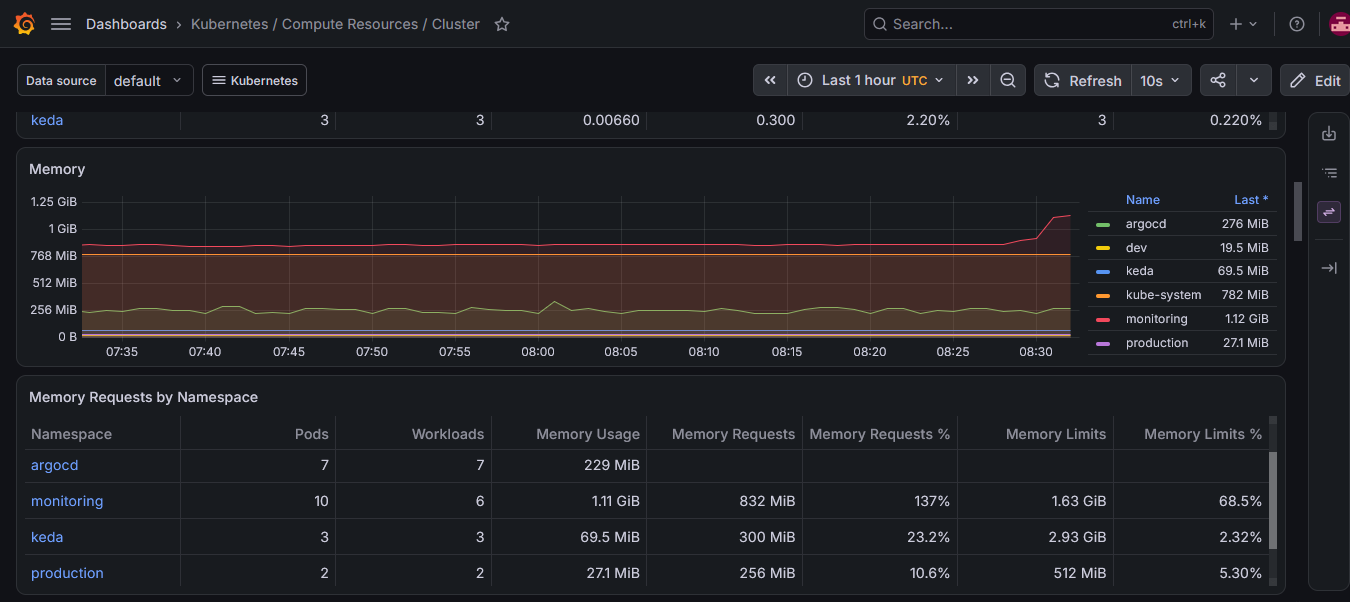
With targets healthy, Grafana immediately had data available through the Prometheus data source. The chart provisions a set of pre-built cluster dashboards automatically — no manual import needed. Port-forward to access:
kubectl port-forward svc/kube-prometheus-stack-grafana 3000:80 -n monitoring
# Open: http://localhost:3000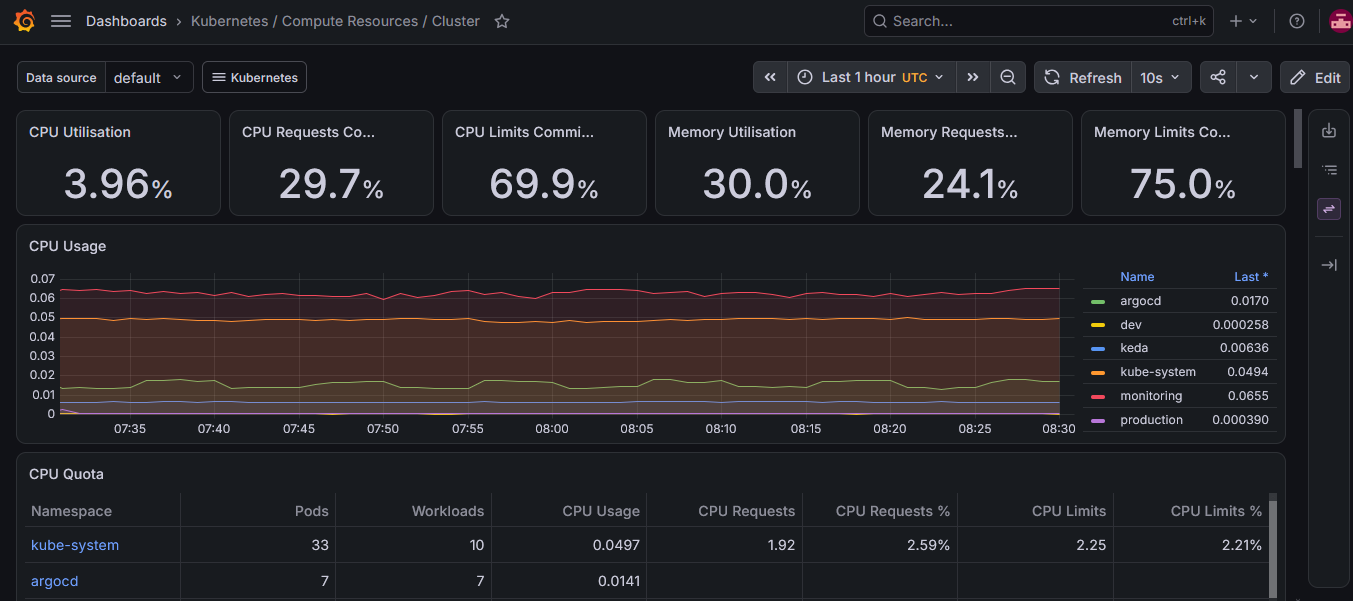
Alertmanager routing
With metrics flowing, the next step was alert routing. Alertmanager uses a routing tree — alerts enter through the root route and are evaluated against child routes according to the configured matching rules. The routing config lives in a Kubernetes Secret rather than the Helm values file:
route:
  group_by: ["alertname", "namespace", "severity"]
  group_wait: 30s        # collect related alerts before sending
  group_interval: 5m     # wait before sending updates to an existing group
  repeat_interval: 4h    # resend a still-firing alert after 4 hours
  receiver: slack-critical

  routes:
    - match:
        severity: critical
      receiver: slack-critical
      group_wait: 10s    # critical alerts fire faster — less grouping delay

    - match:
        severity: warning
      receiver: slack-warning
      group_wait: 60s    # warnings are less urgent, group more aggressively
The group_wait setting matters most in practice. Without grouping, one incident — five pods crashing simultaneously — generates five separate Slack messages. With a 30-second wait, they arrive as one.
Custom alerting rules
The chart ships with a broad set of default rules. Custom rules sit on top as a PrometheusRule resource. Three rules that cover the most common production issues:
- alert: PodContainerRestarting
  # Detects any container restart — rate() measures how fast the
  # restart counter is increasing over the last 15 minutes
  expr: rate(kube_pod_container_status_restarts_total[15m]) > 0
  for: 5m   # requires sustained restarts before firing
  labels:
    severity: critical

- alert: NodeMemoryPressure
  # Fires when available memory falls below 10% of total on any node
  expr: (node_memory_MemAvailable_bytes / node_memory_MemTotal_bytes) < 0.1
  for: 2m
  labels:
    severity: warning

- alert: HighRequestLatency
  # Requires the application to expose an http_request_duration_seconds
  # Prometheus histogram metric. This rule only becomes useful once the
  # application exposes that metric — until then it simply never fires.
  expr: |
    histogram_quantile(0.99,
      sum(rate(http_request_duration_seconds_bucket[5m])) by (le, job)
    ) > 2
  for: 5m
  labels:
    severity: warning
Verifying the full pipeline
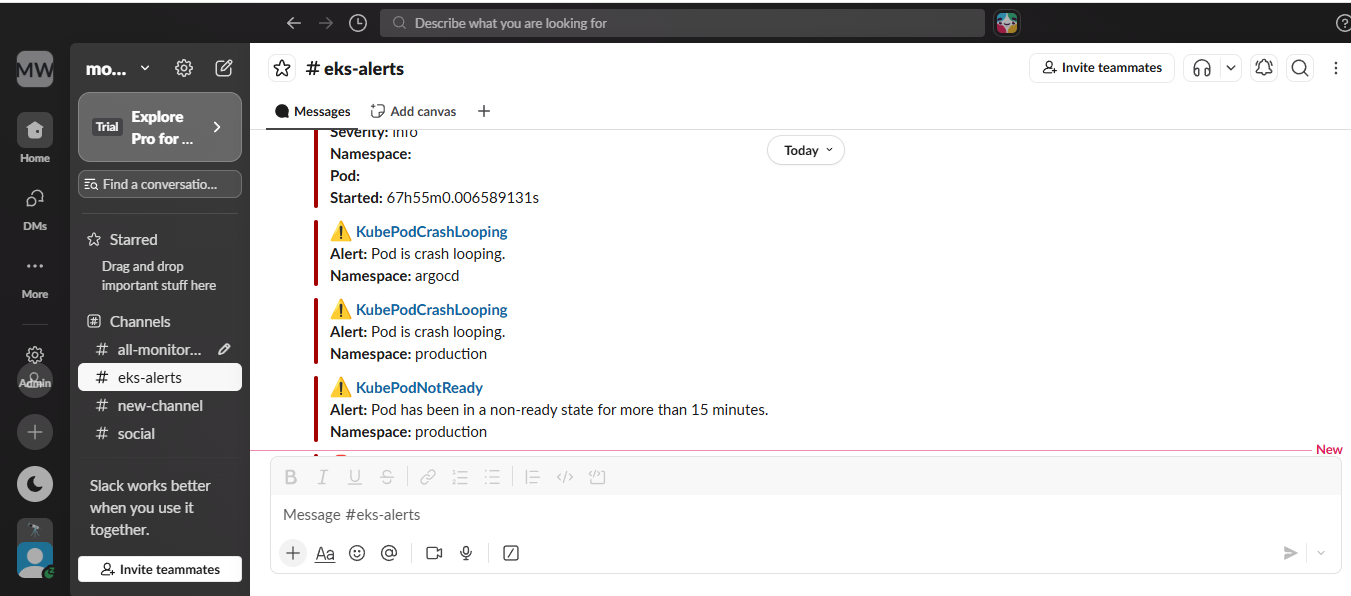
The best way to verify the pipeline end to end is to trigger a controlled test alert. I created a crash-looping pod to trigger the PodContainerRestarting rule:
kubectl run test-crash \
  --image=busybox --restart=Always \
  -n production \
  -- /bin/sh -c 'exit 1'
Once the for: 5m condition is satisfied — meaning the restart-rate expression stays true for five minutes — Prometheus fires the alert to Alertmanager. Alertmanager groups it and routes it to Slack with the pod name, namespace, and restart rate.
kubectl delete pod test-crash -n productionKey decisions
One chart for five components. kube-prometheus-stack bundles everything with a Prometheus operator that manages Prometheus and Alertmanager as Kubernetes custom resources. Running them as separate charts would require manually wiring data sources and service discovery between components — the operator handles all of that.
Alertmanager config as a Kubernetes Secret, not Helm values. The Slack webhook URL lives in a Secret applied after the Helm install. A webhook URL committed to a values file in a repository can be used by anyone with read access to post to your Slack channel. The separation also means you can rotate the webhook without touching the Helm release.
Dashboards provisioned from ConfigMaps. Grafana's sidecar watches for ConfigMaps labelled grafana_dashboard: "1" and loads them automatically. Dashboards are version-controlled in Git and reproduced identically on every deployment — no manual clicking in the UI, no dashboards that exist only on one Grafana instance.
EBS CSI driver for persistent storage. Without persistent storage, Prometheus loses its locally stored time-series data when its pod is recreated. The EBS CSI driver is a non-obvious dependency on EKS — the addon installs without error even when the IAM role is missing, but the driver cannot provision EBS volumes, and Prometheus and Alertmanager will stay Pending waiting for storage that never arrives. Checking for AccessDenied: Not authorized to perform sts:AssumeRoleWithWebIdentity in the driver logs is the fastest way to diagnose this.
Everything managed through Git. Helm values, PrometheusRules, Grafana dashboards, and Kubernetes manifests are all kept in the repository so the monitoring stack can be recreated consistently. Secrets are handled separately and are never committed.
Scaling to multiple clusters
What is deployed here works well for a single cluster. In a real multi-environment setup — staging, production, dev — this approach does not scale. Installing a full Prometheus and Grafana stack on every cluster means maintaining separate Grafana instances, duplicating alert rules across environments, and losing any unified view of the system.
The production pattern is a single centralised observability platform with lightweight agents on each cluster:

Prometheus runs in Agent mode on each cluster — it scrapes metrics locally but does not store them. Instead it uses remote_write to ship everything to a central storage backend, either Grafana Mimir or Thanos. Central Grafana connects to that backend and can filter by cluster or environment. One Grafana instance, one set of dashboards, one set of alert rules — covering everything.
The same pattern applies to logs and traces. Grafana Alloy on each cluster ships logs to a single central Loki. OpenTelemetry Collector on each cluster ships traces to a single central Tempo. This is what managed observability platforms like Datadog handle automatically — the multi-cluster aggregation, the central view, the agent management. Building it with the open source stack makes the abstraction visible.
For this project, a single cluster with a local Prometheus stack is the right starting point. The multi-cluster extension is a natural next step once the single-cluster foundation is solid.
What I learned
The biggest lesson from this setup was that installing the monitoring stack is only part of the job. The AWS dependencies underneath it matter just as much.
I initially ran into the EBS CSI driver problem. The addon was installed but the driver did not have the IAM permissions it needed to provision EBS volumes. The result was that the Prometheus and Alertmanager PVCs stayed Pending indefinitely. The error in the driver logs pointed to sts:AssumeRoleWithWebIdentity, which led me back to the IAM role and the OIDC trust relationship. Once that was fixed, the volumes provisioned normally and both StatefulSets started.
I also hit the Alertmanager Secret ownership conflict. kube-prometheus-stack creates and manages its own Secret, so creating a custom Secret before the Helm deployment caused an ownership conflict — Helm expected the Secret to carry its own ownership annotations. The fix was to let Helm create the resource first, then apply the Slack routing config separately and restart Alertmanager. That also gave a cleaner separation between the Helm deployment and the webhook secret.
The main takeaway was that Kubernetes observability is not just about installing Prometheus and Grafana. Storage, IAM, resource ownership, configuration management, and alert routing all have to work together for the stack to actually be useful.
Part 2 adds log aggregation using Loki and Grafana Alloy. Logs answer the question metrics cannot: not just that a pod is restarting, but what error message it is printing when it does. Part 2 — Log aggregation (coming soon)
Comments
All comments are reviewed before appearing.
Leave a Comment