

We had an ALB in front, five Unicorn workers behind it, and HPA watching CPU and memory. Traffic came in, the ALB distributed it, workers processed it. It worked fine — until Fraudguard went down.
When Fraudguard became unavailable, every request that touched it started hanging. The workers were not crashing. They were just waiting — stuck in I/O, holding open connections, not releasing. The ALB kept routing new requests to them because they still showed as healthy. The queue grew. Users started seeing 502s.
Here is the part that took us a while to understand: HPA saw nothing wrong. CPU was at 45%. Memory was at 40%. Our thresholds were 60% and 50%. No scale event ever fired. The problem was not that we needed more pods — we could have used more — the problem was that HPA had no way to know we needed them. It was only watching two numbers, and neither of those numbers was telling the truth about what was actually happening.
Meanwhile, our ALB had the real picture the whole time. It knew exactly how many requests were sitting in the queue per pod. It knew response times were climbing. It was publishing all of that to CloudWatch every minute. We just had nothing connected to it.
That is what led us to KEDA — not to replace the ALB, but to finally use what the ALB was already telling us.

The Problem with HPA
HPA works well for workloads where CPU is a reliable signal — computation-heavy jobs where more requests genuinely means more CPU. But most web applications spend a lot of time waiting: on database queries, external APIs, file reads. The CPU is idle. The process is blocked. HPA looks at that and thinks everything is fine.
Traditional HPA:
  Scale when CPU or memory crosses a threshold

The reality for I/O-bound workloads:
  Pods can be completely overloaded with queued requests
  while CPU stays at 20-45% — workers are just waiting
  HPA sees no problem. Users get 502s.
This is not a bug. It is a design limitation. HPA was built around specific signals. The problem is when those signals do not reflect what users are experiencing.
What KEDA Is
KEDA (Kubernetes Event Driven Autoscaling) gives Kubernetes the ability to scale on almost anything — not just CPU and memory. It sits alongside HPA, creates and manages one behind the scenes, and feeds it external metrics that Kubernetes alone cannot access.
SourceExample metricCloudWatchALB RequestCountPerTargetSQSQueue depthKafkaConsumer lagPrometheusAny custom metricRedisList lengthDatadogAPM metricsCronTime-based scaling
In our case, the right source was already there: CloudWatch, via the ALB.
Why ALB Metrics Are the Right Signal
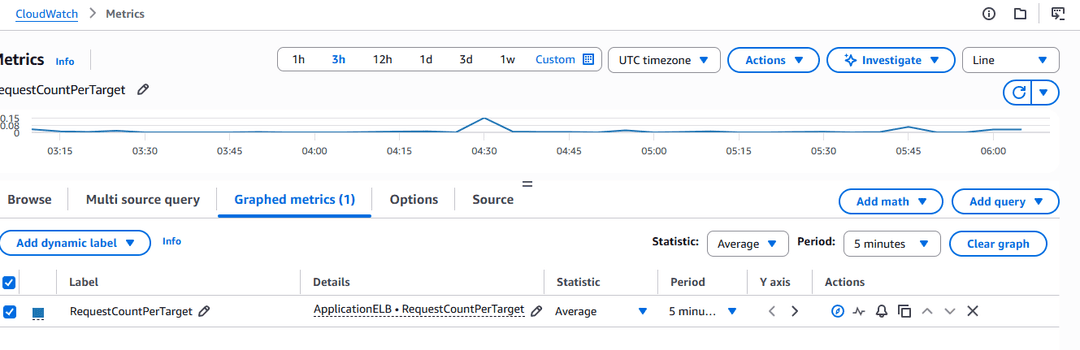
The ALB sees traffic before your pods do. By the time CPU starts climbing, the ALB has already been tracking request rates, response times, and queue depth for the past minute. It publishes a metric called RequestCountPerTarget to CloudWatch — the average number of active requests per registered pod.
This directly answers the question HPA cannot: how loaded is each pod right now, regardless of what CPU is doing?

The Scaling Calculation
KEDA uses the same formula as HPA — it just feeds it a better number:

Set a target of 10 requests per pod. When the ALB reports 42 active requests across the target group, KEDA calculates ceil(42/10) = 5 and tells the HPA to run 5 pods. When traffic drops to zero, it can scale all the way to zero — something HPA cannot do on its own.
Setting It Up
Step 1: Install KEDA
helm repo add kedacore https://kedacore.github.io/charts
helm repo update

helm install keda kedacore/keda \
  --namespace keda \
  --create-namespace
kubectl get pods -n keda
# keda-operator 1/1 Running
# keda-operator-metrics-apiserver 1/1 Running
Step 2: Give KEDA Permission to Read CloudWatch
On EKS, use IRSA — attach an IAM role to the KEDA service account. No credentials stored in the cluster. First find your Target Group ARN:
aws elbv2 describe-target-groups \
  --query 'TargetGroups[?TargetGroupName==`my-app-tg`].TargetGroupArn' \
  --output text
# arn:aws:elasticloadbalancing:eu-west-1:123456789:targetgroup/my-app-tg/abc123def456
{
"Version": "2012-10-17",
"Statement": [
{
"Effect": "Allow",
"Action": [
"cloudwatch:GetMetricData",
"cloudwatch:GetMetricStatistics",
"cloudwatch:ListMetrics"
],
"Resource": "*"
},
{
"Effect": "Allow",
"Action": [
"elasticloadbalancing:DescribeTargetGroups",
"elasticloadbalancing:DescribeLoadBalancers"
],
"Resource": "*"
}
]
}aws iam create-policy \
--policy-name KedaCloudWatchPolicy \
--policy-document file://keda-policy.json
eksctl create iamserviceaccount \
--cluster my-cluster \
--namespace keda \
--name keda-operator \
--attach-policy-arn arn:aws:iam::ACCOUNT_ID:policy/KedaCloudWatchPolicy \
--approve \
--override-existing-serviceaccounts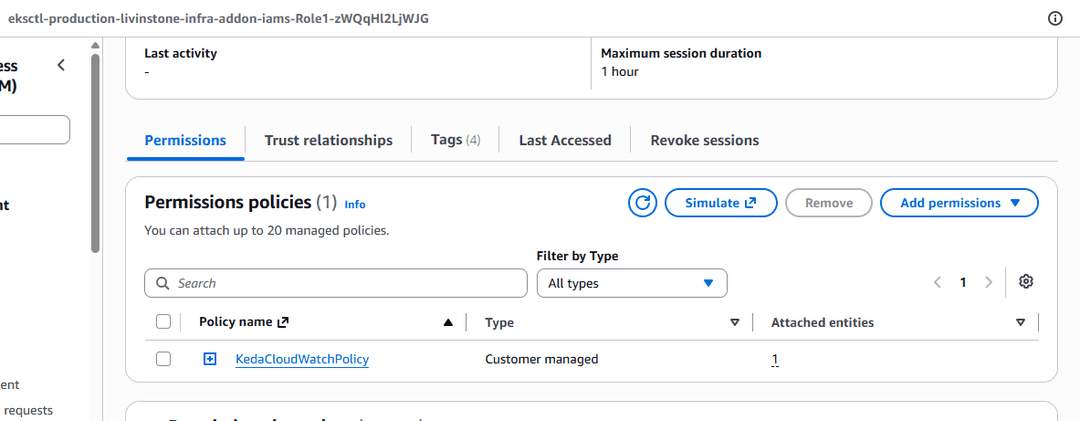
Step 3: Create the ScaledObject
apiVersion: keda.sh/v1alpha1
kind: ScaledObject
metadata:
  name: my-app-scaler
  namespace: production
spec:
  scaleTargetRef:
    name: my-app          # Your Deployment name
  minReplicaCount: 1      # Keep at least 1 pod in production
  maxReplicaCount: 20
  cooldownPeriod: 300     # Wait 5 min before scaling down

  triggers:
  - type: aws-cloudwatch
    metadata:
      namespace: AWS/ApplicationELB
      dimensionName: TargetGroup
      # The section after the account ID in your Target Group ARN
      dimensionValue: "targetgroup/my-app-tg/abc123def456"
      metricName: RequestCountPerTarget
      targetMetricValue: "10"      # Max requests per pod
      minMetricValue: "0"
      metricCollectionTime: "120"  # 2-minute average for stability
      metricStatistic: Average
      awsRegion: "eu-west-1"
      identityOwner: operator
kubectl apply -f scaledobject.yaml
kubectl get hpa -n production
# NAME REFERENCE TARGETS MINPODS MAXPODS REPLICAS
# keda-hpa-my-app-scaler Deployment/my-app 42/10 1 20 5
# ^^^^^
# current / targetStep 4: Keep CPU and Memory Scaling Too
Multiple triggers in one ScaledObject. KEDA always picks the highest replica count any trigger recommends:
triggers:
- type: aws-cloudwatch
  metadata:
    metricName: RequestCountPerTarget
    targetMetricValue: "10"
    # ... rest of CloudWatch config

- type: cpu
  metricType: Utilization
  metadata:
    value: "60"

- type: memory
  metricType: Utilization
  metadata:
    value: "50"
Delete any existing standalone HPA first — KEDA creates a new one and manages it. Two HPAs on the same Deployment conflict.
Finding the Right Target Value
Look at historical CloudWatch data and find where things started going wrong during your last incident. What was RequestCountPerTarget at that point? Set your target below it.
aws cloudwatch get-metric-statistics \
  --namespace AWS/ApplicationELB \
  --metric-name RequestCountPerTarget \
  --dimensions Name=TargetGroup,Value=targetgroup/my-app-tg/abc123 \
  --start-time $(date -u -d '1 hour ago' +%Y-%m-%dT%H:%M:%S) \
  --end-time $(date -u +%Y-%m-%dT%H:%M:%S) \
  --period 60 \
  --statistics Average \
  --region eu-west-1
What to Watch
RequestCountPerTarget — the number KEDA is watching
TargetResponseTime — proof that scaling is actually helping
HTTPCode_ELB_5XX_Count — should drop near zero once tuned
HealthyHostCount — new pods registering after scale-up
After the Fix
The Fraudguard outage lasted a few hours. A similar downstream issue came up a few weeks after KEDA was in place. Same pattern — requests started backing up. This time KEDA detected the rising request count within 30 seconds, pods were scaling within a minute. Users saw slower responses briefly. No 502s.
Nothing changed about the ALB. Nothing changed about how Unicorn works. The only thing that changed was what the autoscaler was paying attention to. HPA was doing its job — it just was not designed for workloads where CPU tells you nothing useful. KEDA fills that gap by reading signals that were already there, already accurate, already being published. We just needed something to listen.
This runs on the EKS cluster in Building a Production EKS Cluster from Scratch. The ScaledObject lives in the GitOps repo and gets deployed via Argo CD alongside the Deployment.
Comments
All comments are reviewed before appearing.
Leave a Comment